Contextualizing data with AI and data visualization.
Visual8 is the product of my senior capstone project, completed collaboratively alongside three other Computer Science students. Over the course of the Fall 2023 semester, our group worked closely with a San Francisco-based Artificial Intelligence start up to apply our technical skills for one final project and bring one of their key features to life.
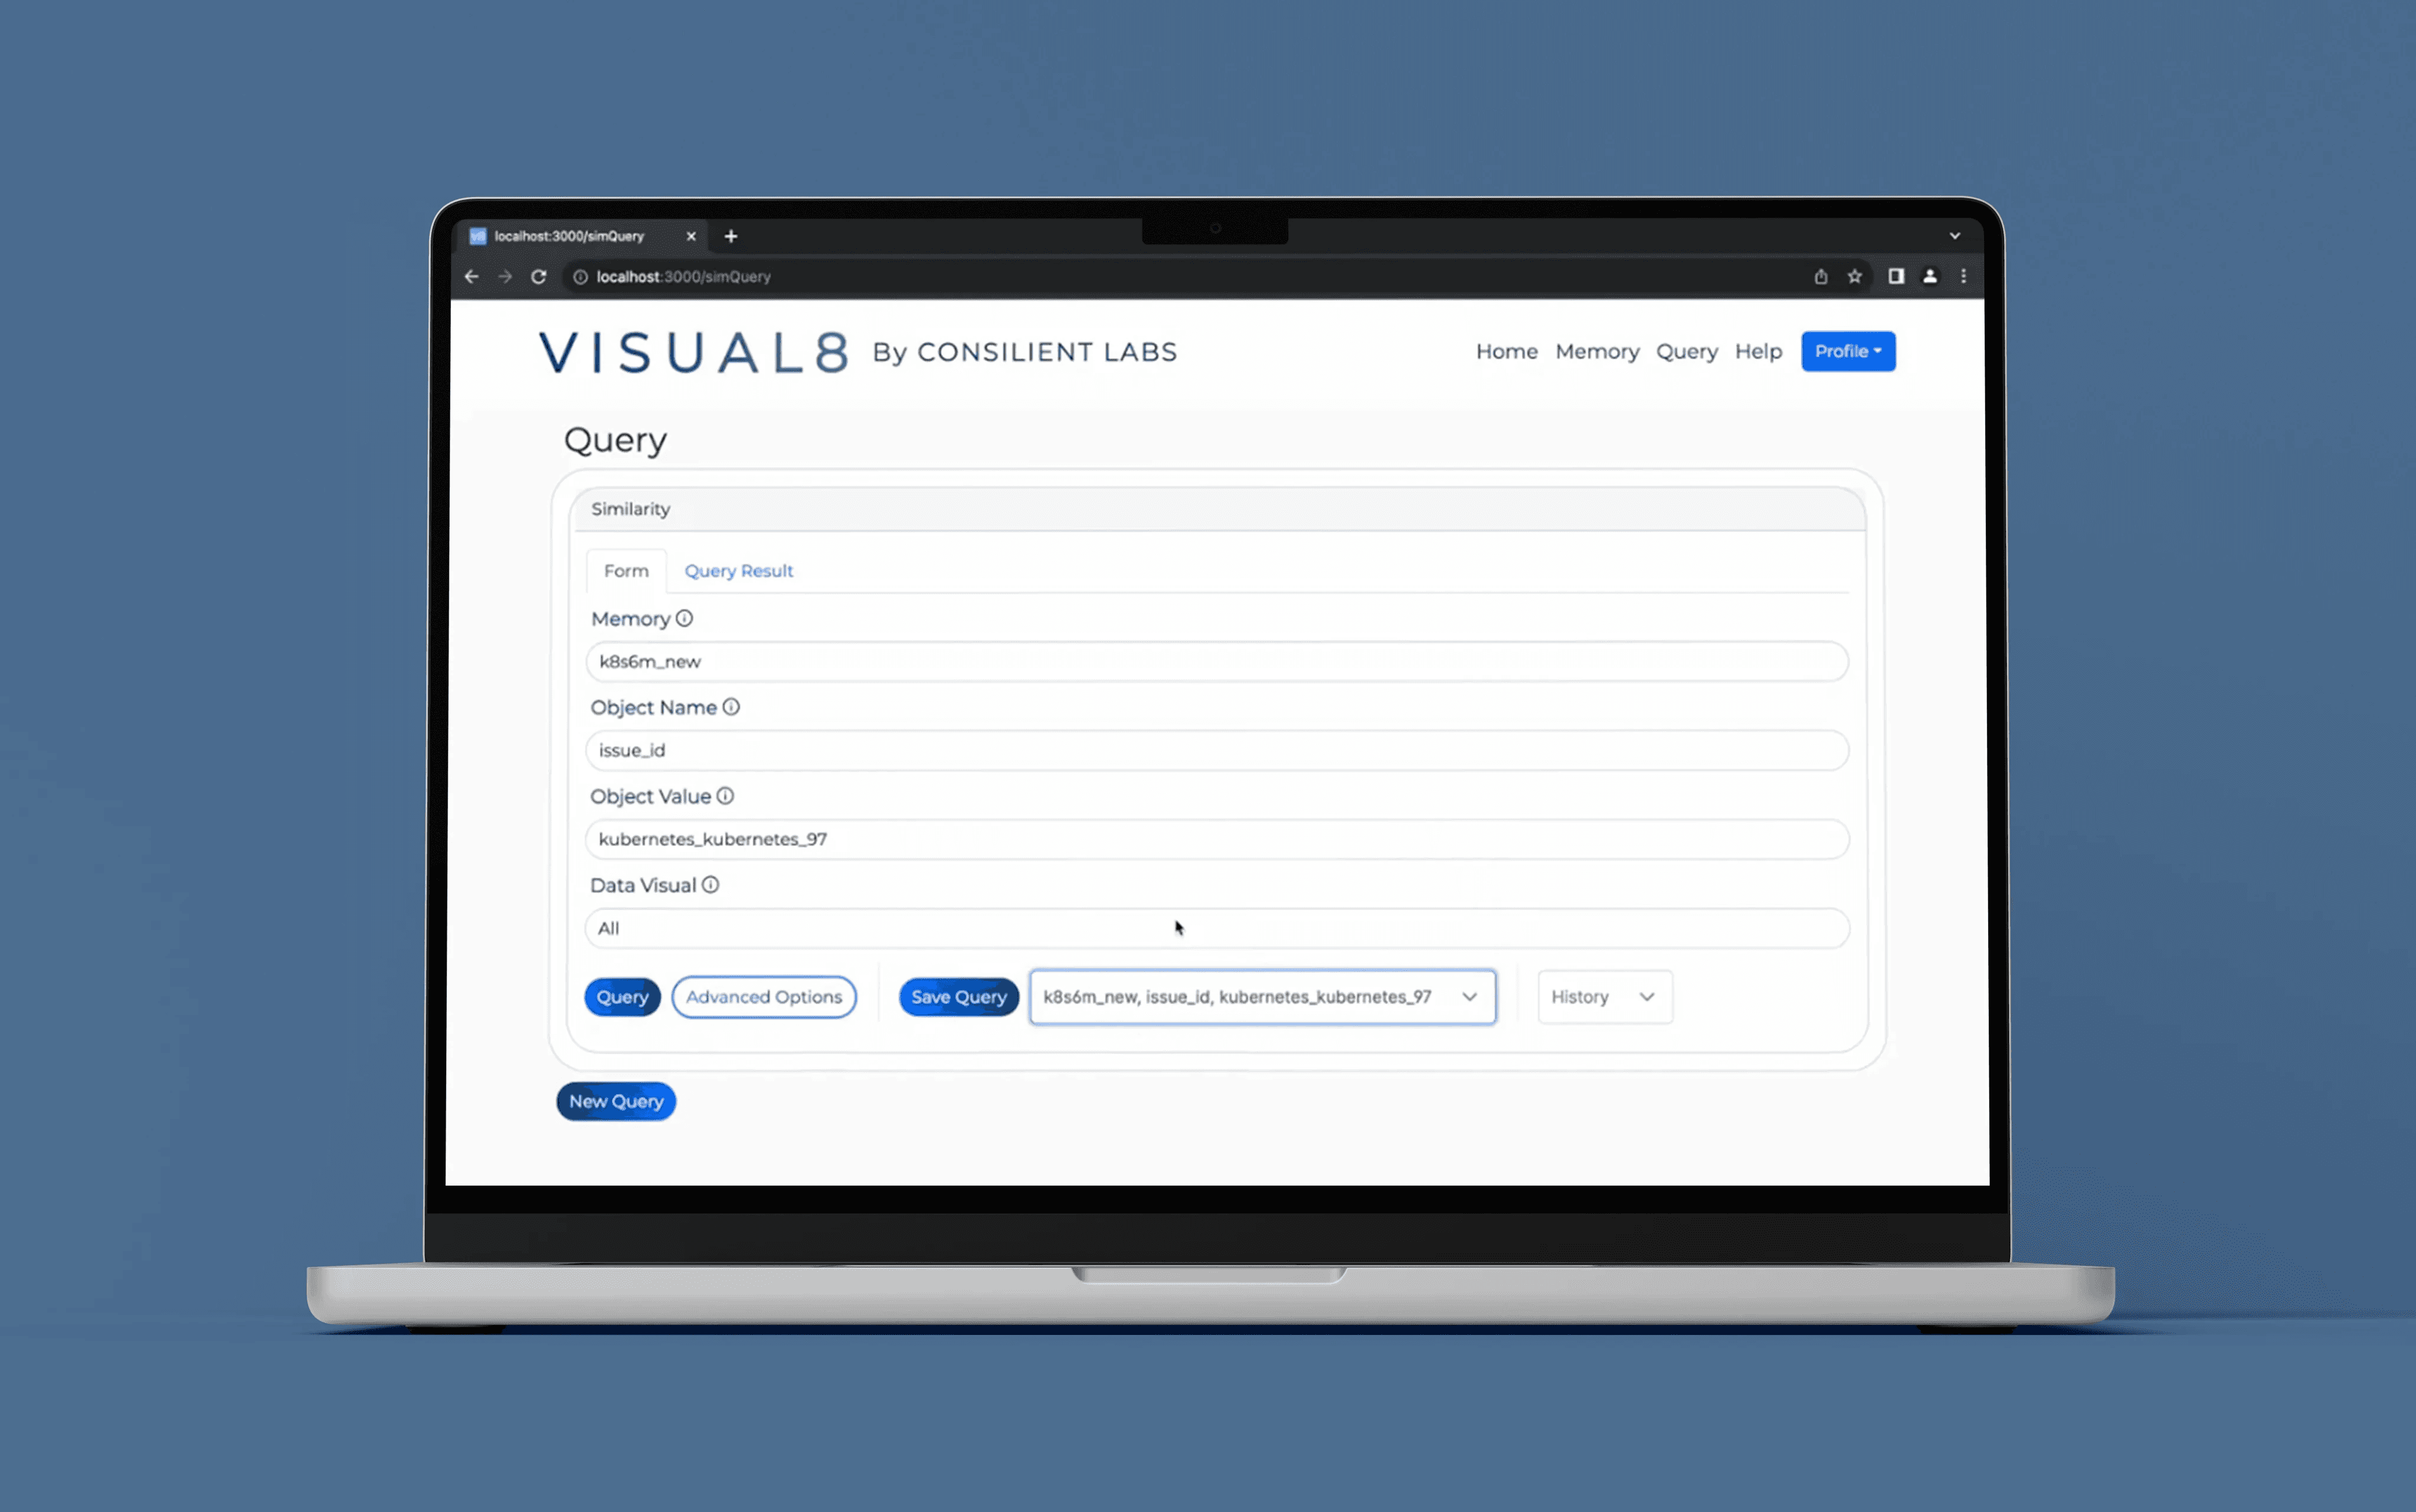
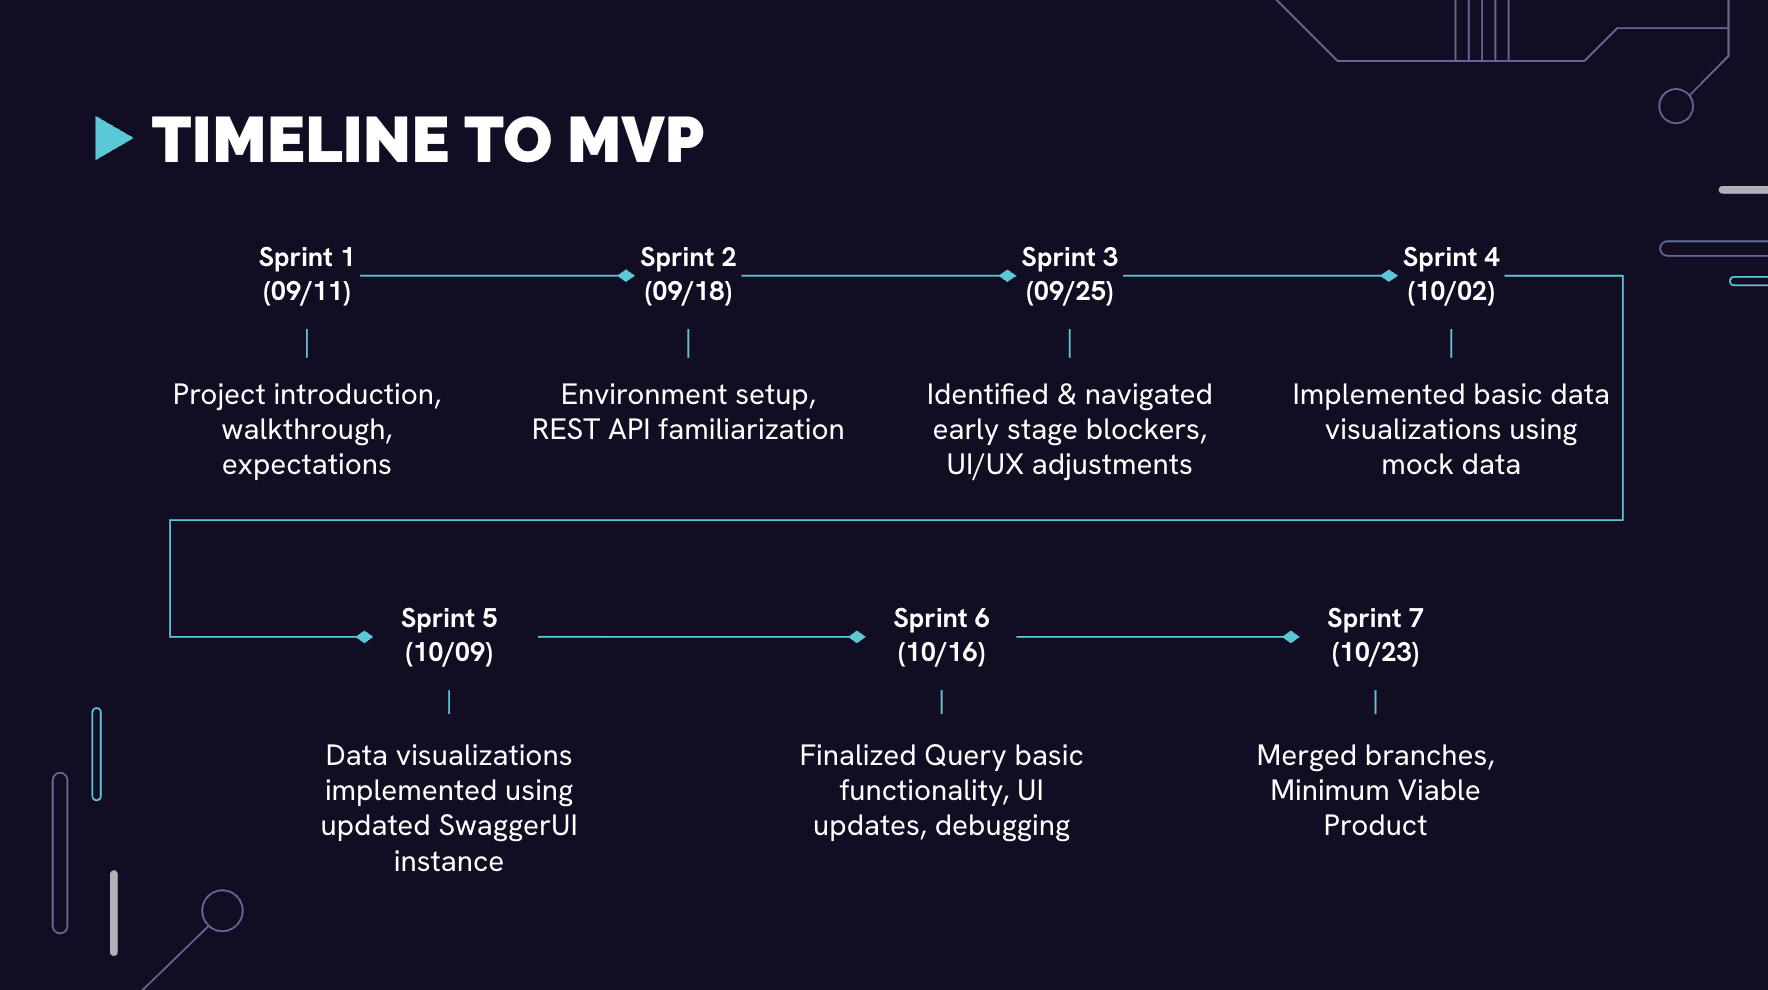
The challenge was to translate complex data that had been queried by ETLs (Extract, Transform, Load) into interactive, digestible visuals. Through regular group meetings, bi-weekly scrums with representatives from our sponsor company , and weekly progress-assessments with stakeholders, our group achieved Minimum Viable Product by the midterm checkpoint, continued scaling, and presented an extended and further refined product at the end of the semester.
YEAR
2023
ROLE
CO-FRONTEND DEV
UX DESIGNER
DURATION
3.5 MONTHS


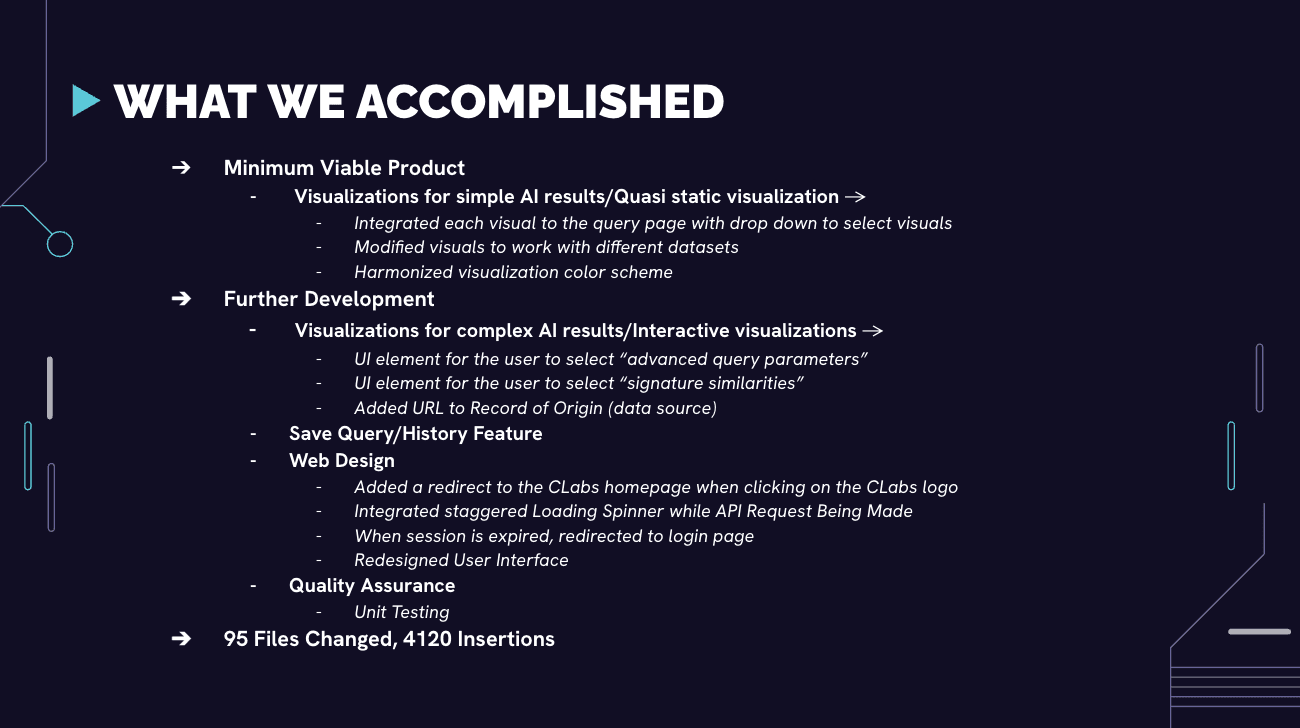
Minimum Viable Product
01
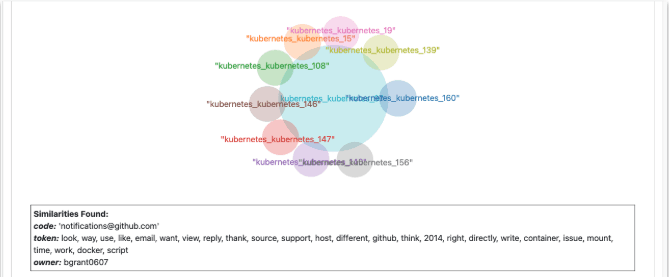
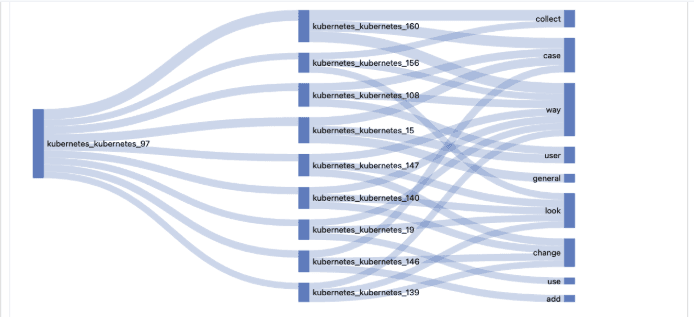
Visualizations for simple AI results/Quasi static visualization
02
D3js for Visualization (Bar Graph, Venn Diagram, Bar Graph Detail Venn Diagram, Sankey Chart)
03
Interactive Visualizations